DIMENSION
Gallery Space
15’W x 7’H x 25’D
BUILT FOR TABLET
PAPER
BRAND | Epson
WEIGHT | 100lb 45” Roll
COLOR | Natural White
FINISH | Enhanced Matte
SOFTWARE
COLOR
TYPOGRAPHY
Caecilia
Helvetica
![]()
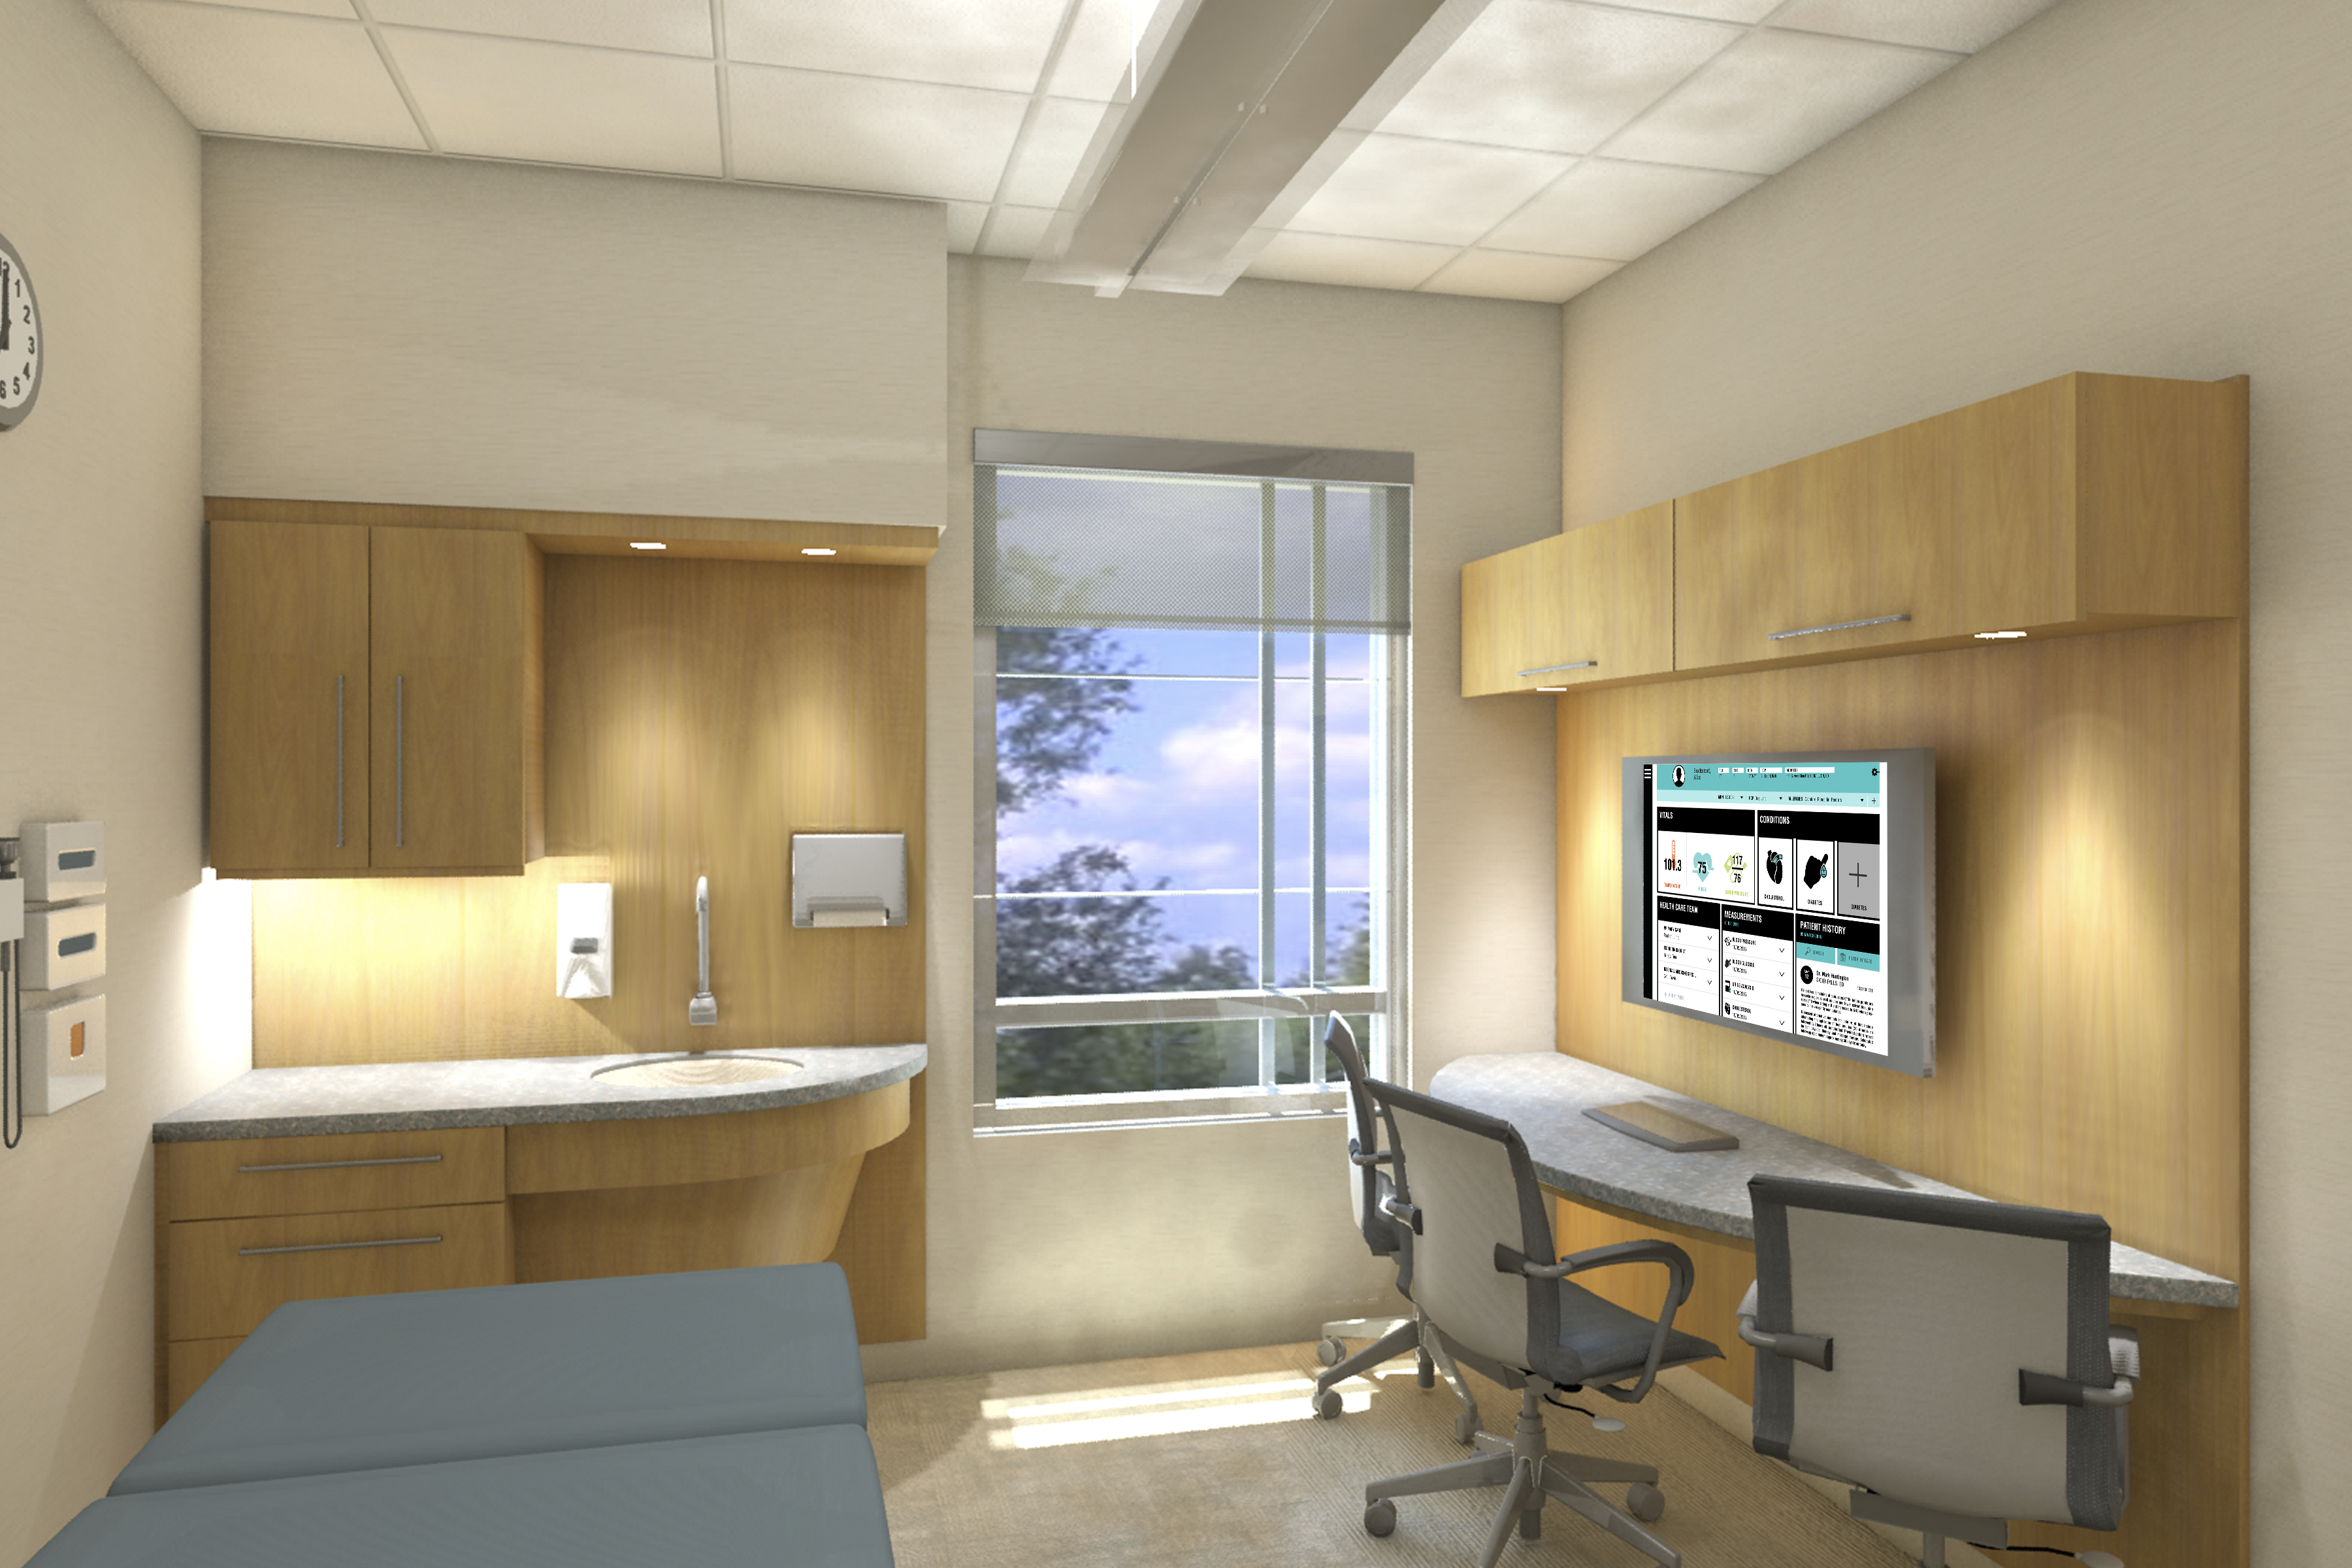
Communicating Medical Information Through Pictograms: A Case Study for Type II Diabetes Quality Measures.
Visual health information is most commonly portrayed through the written word. This limits accessibility of the information to people with moderate literacy. The goal of this research is to see how the emphasis of user-centered visual communication can aid the exchange and understanding of healthcare information. This research uses a qualitative method through literature review, market research, survey collection, and personal observation. Research in the fields of visual literacy, health literacy, UX, UI, and HCI are employed as defense for decisions made during the design process.
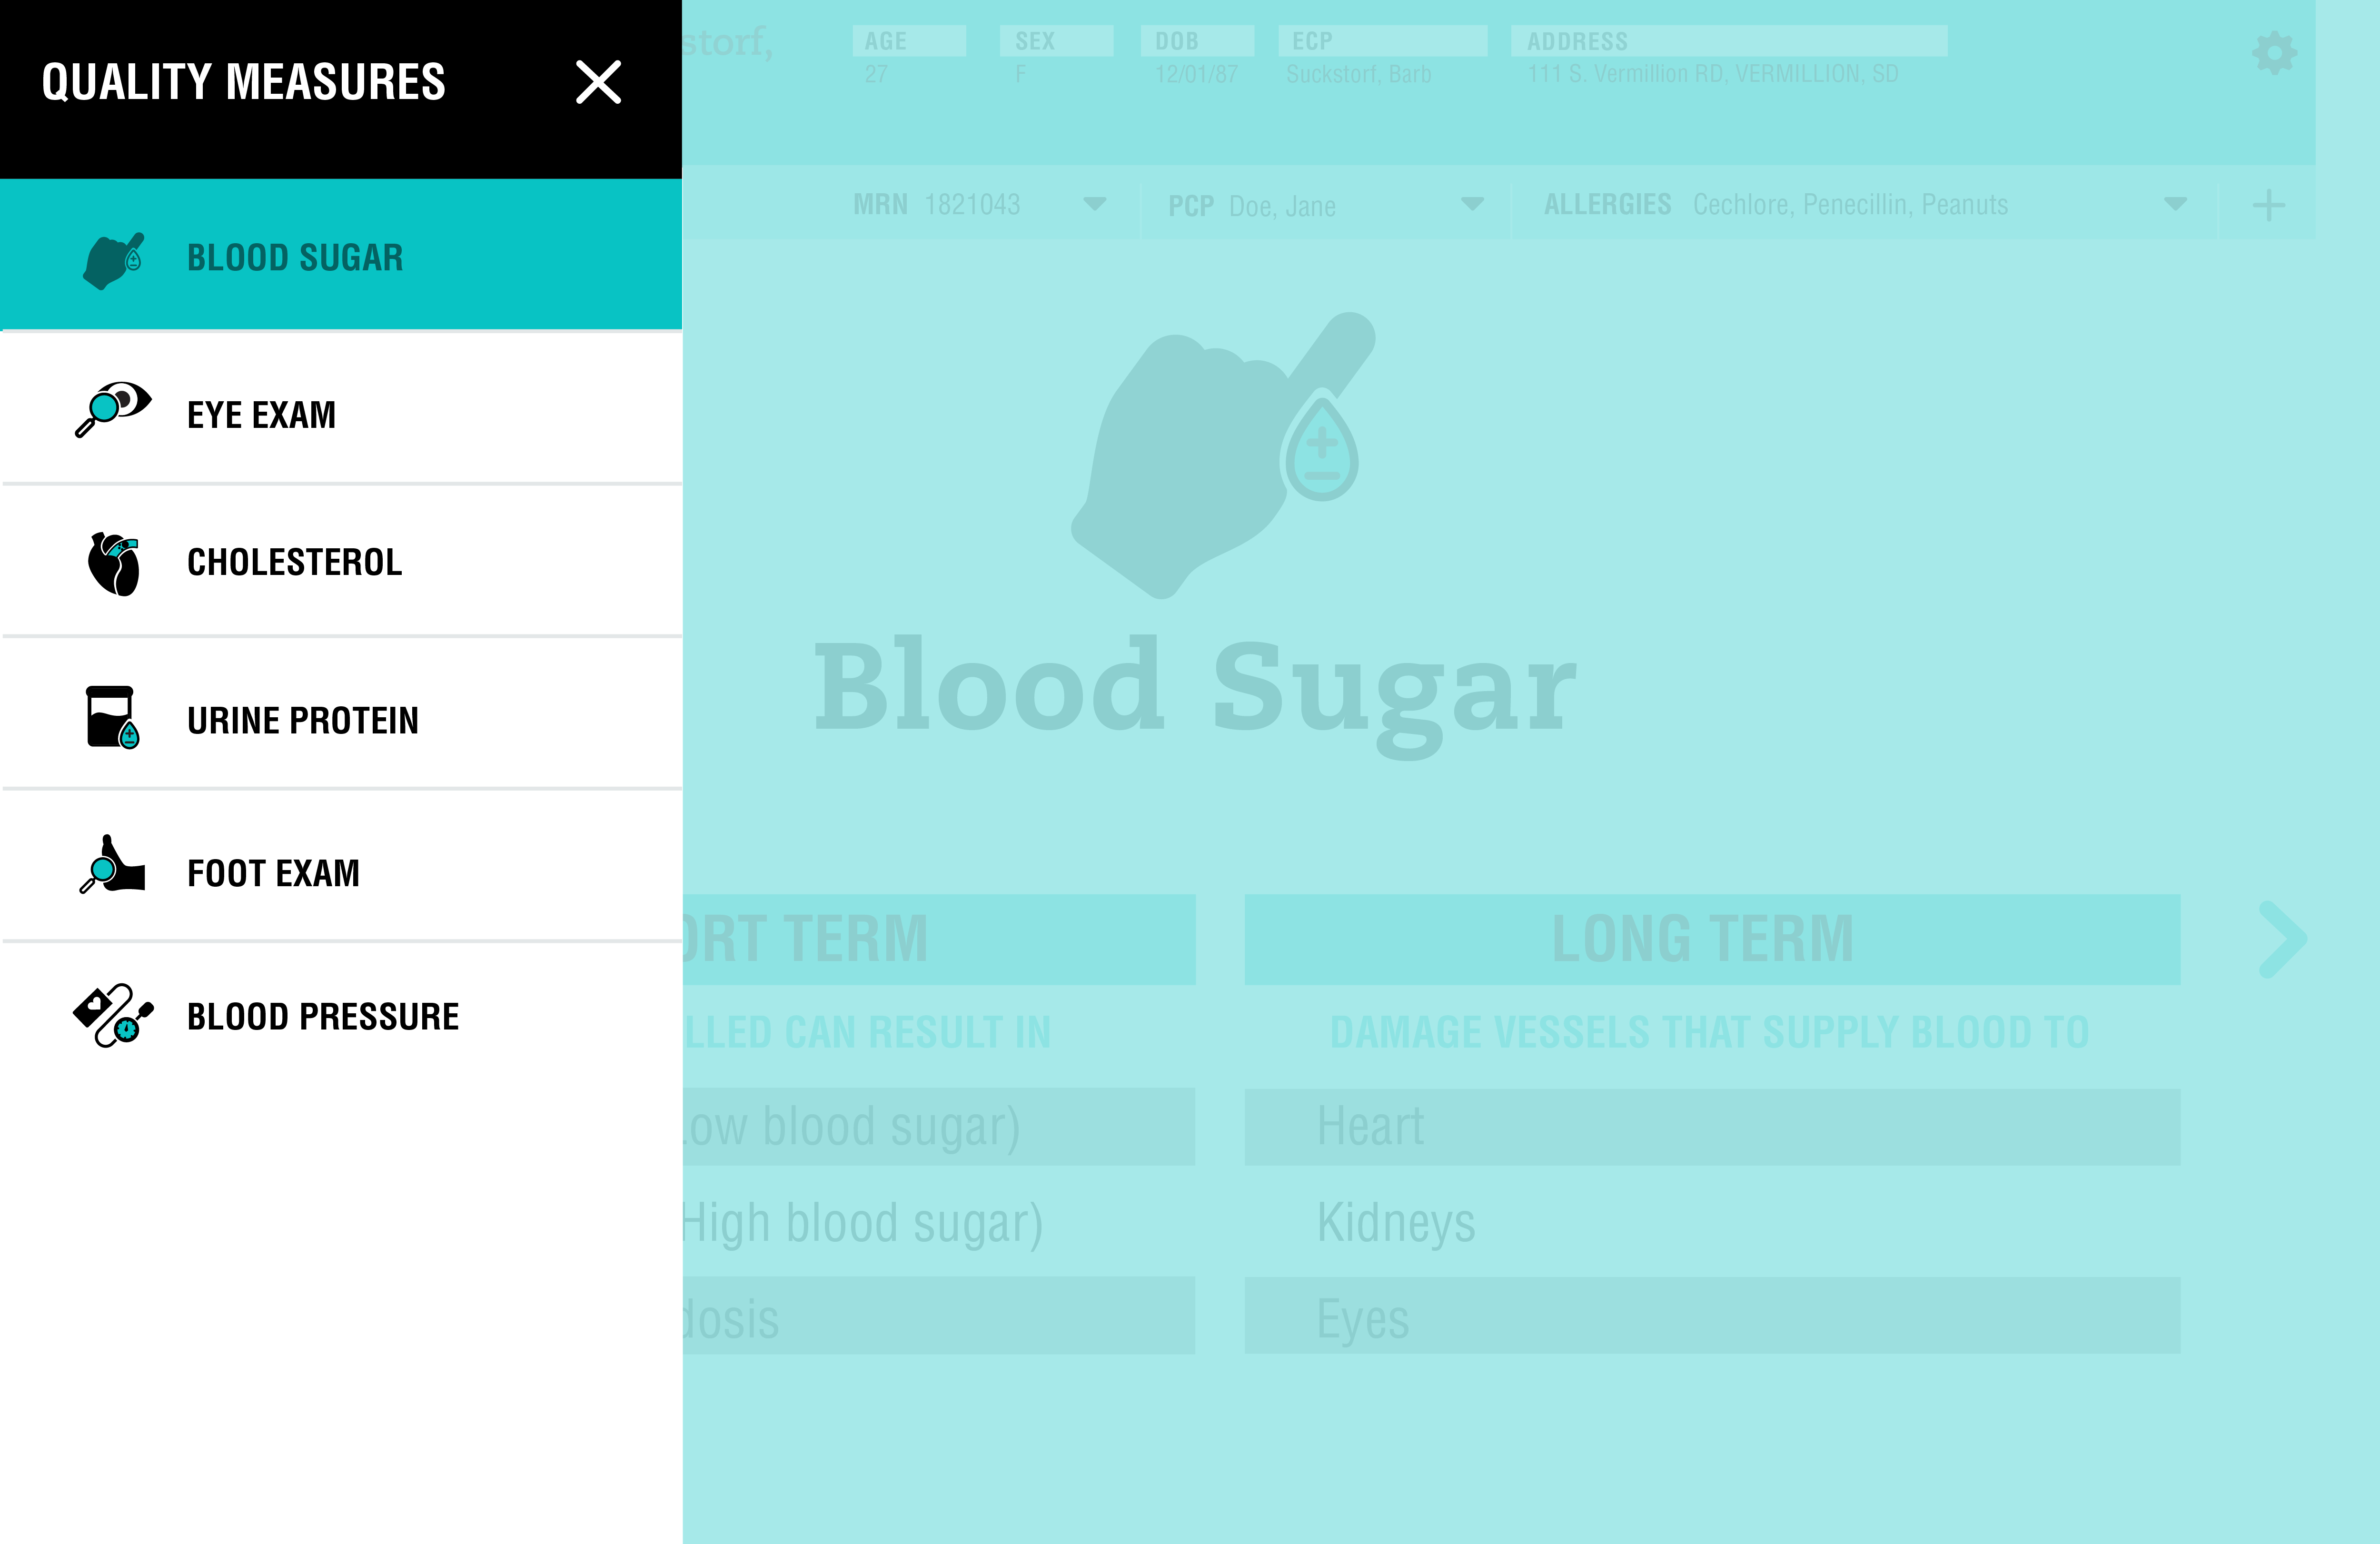
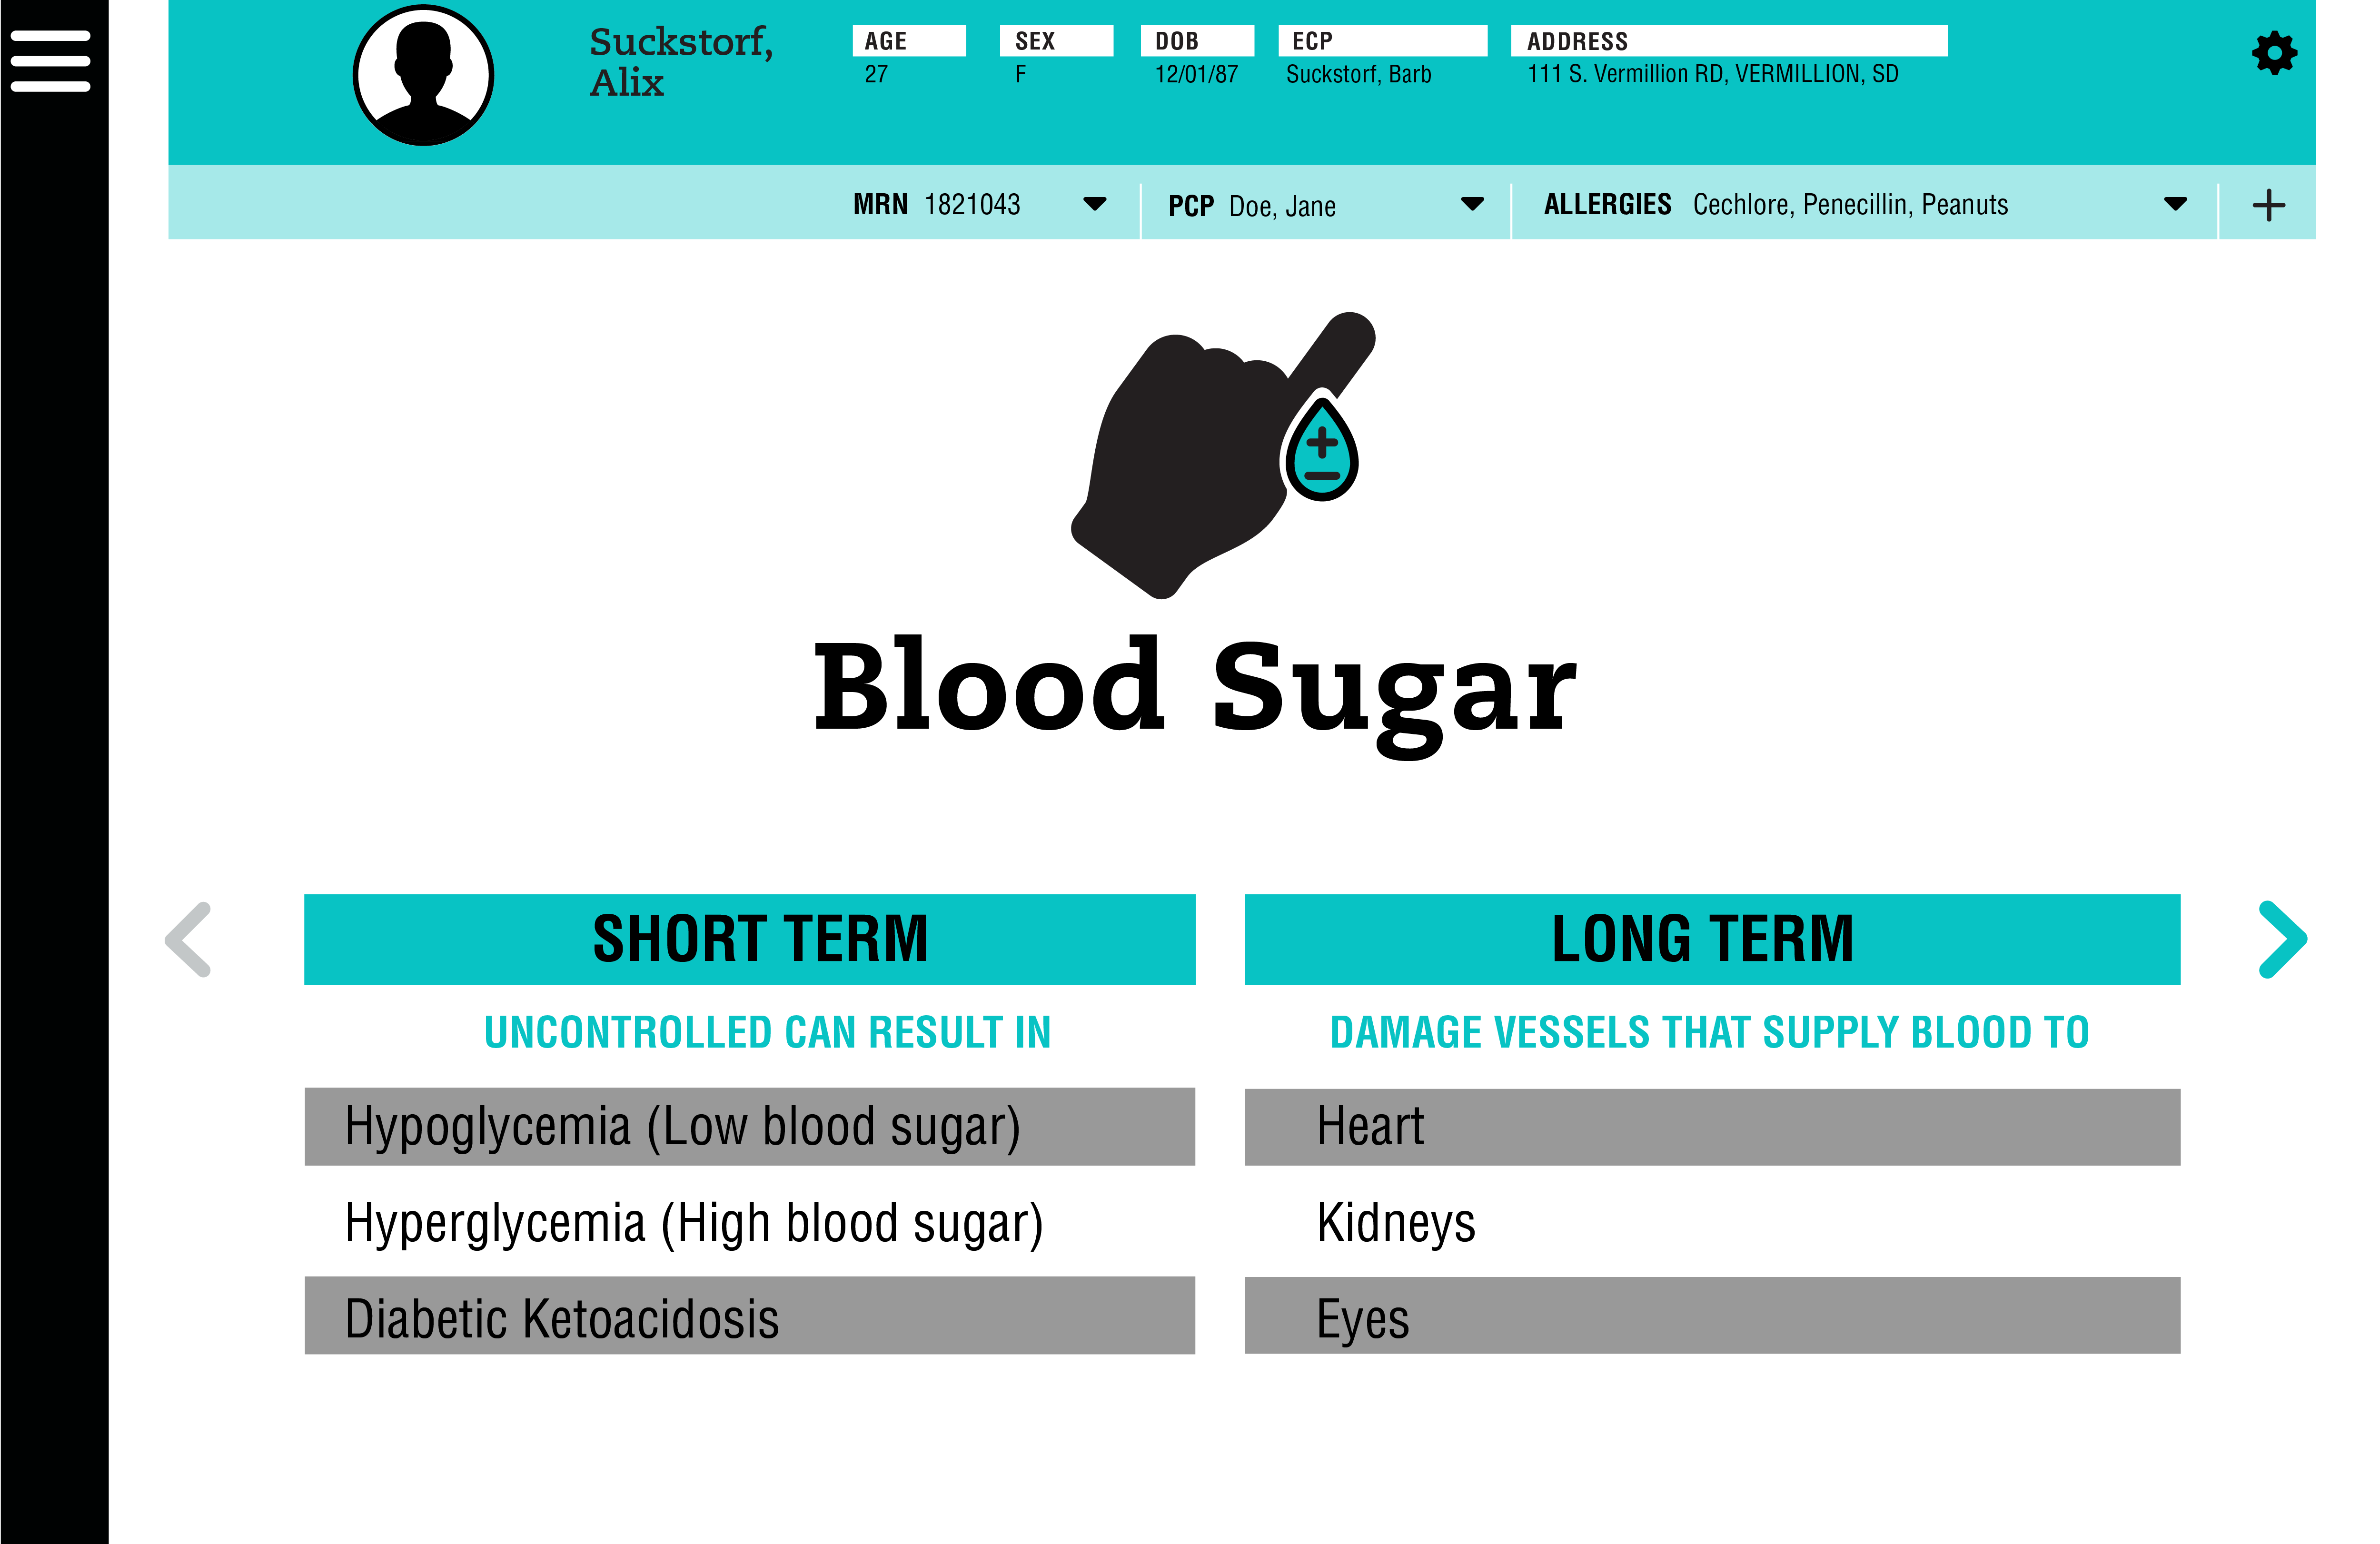
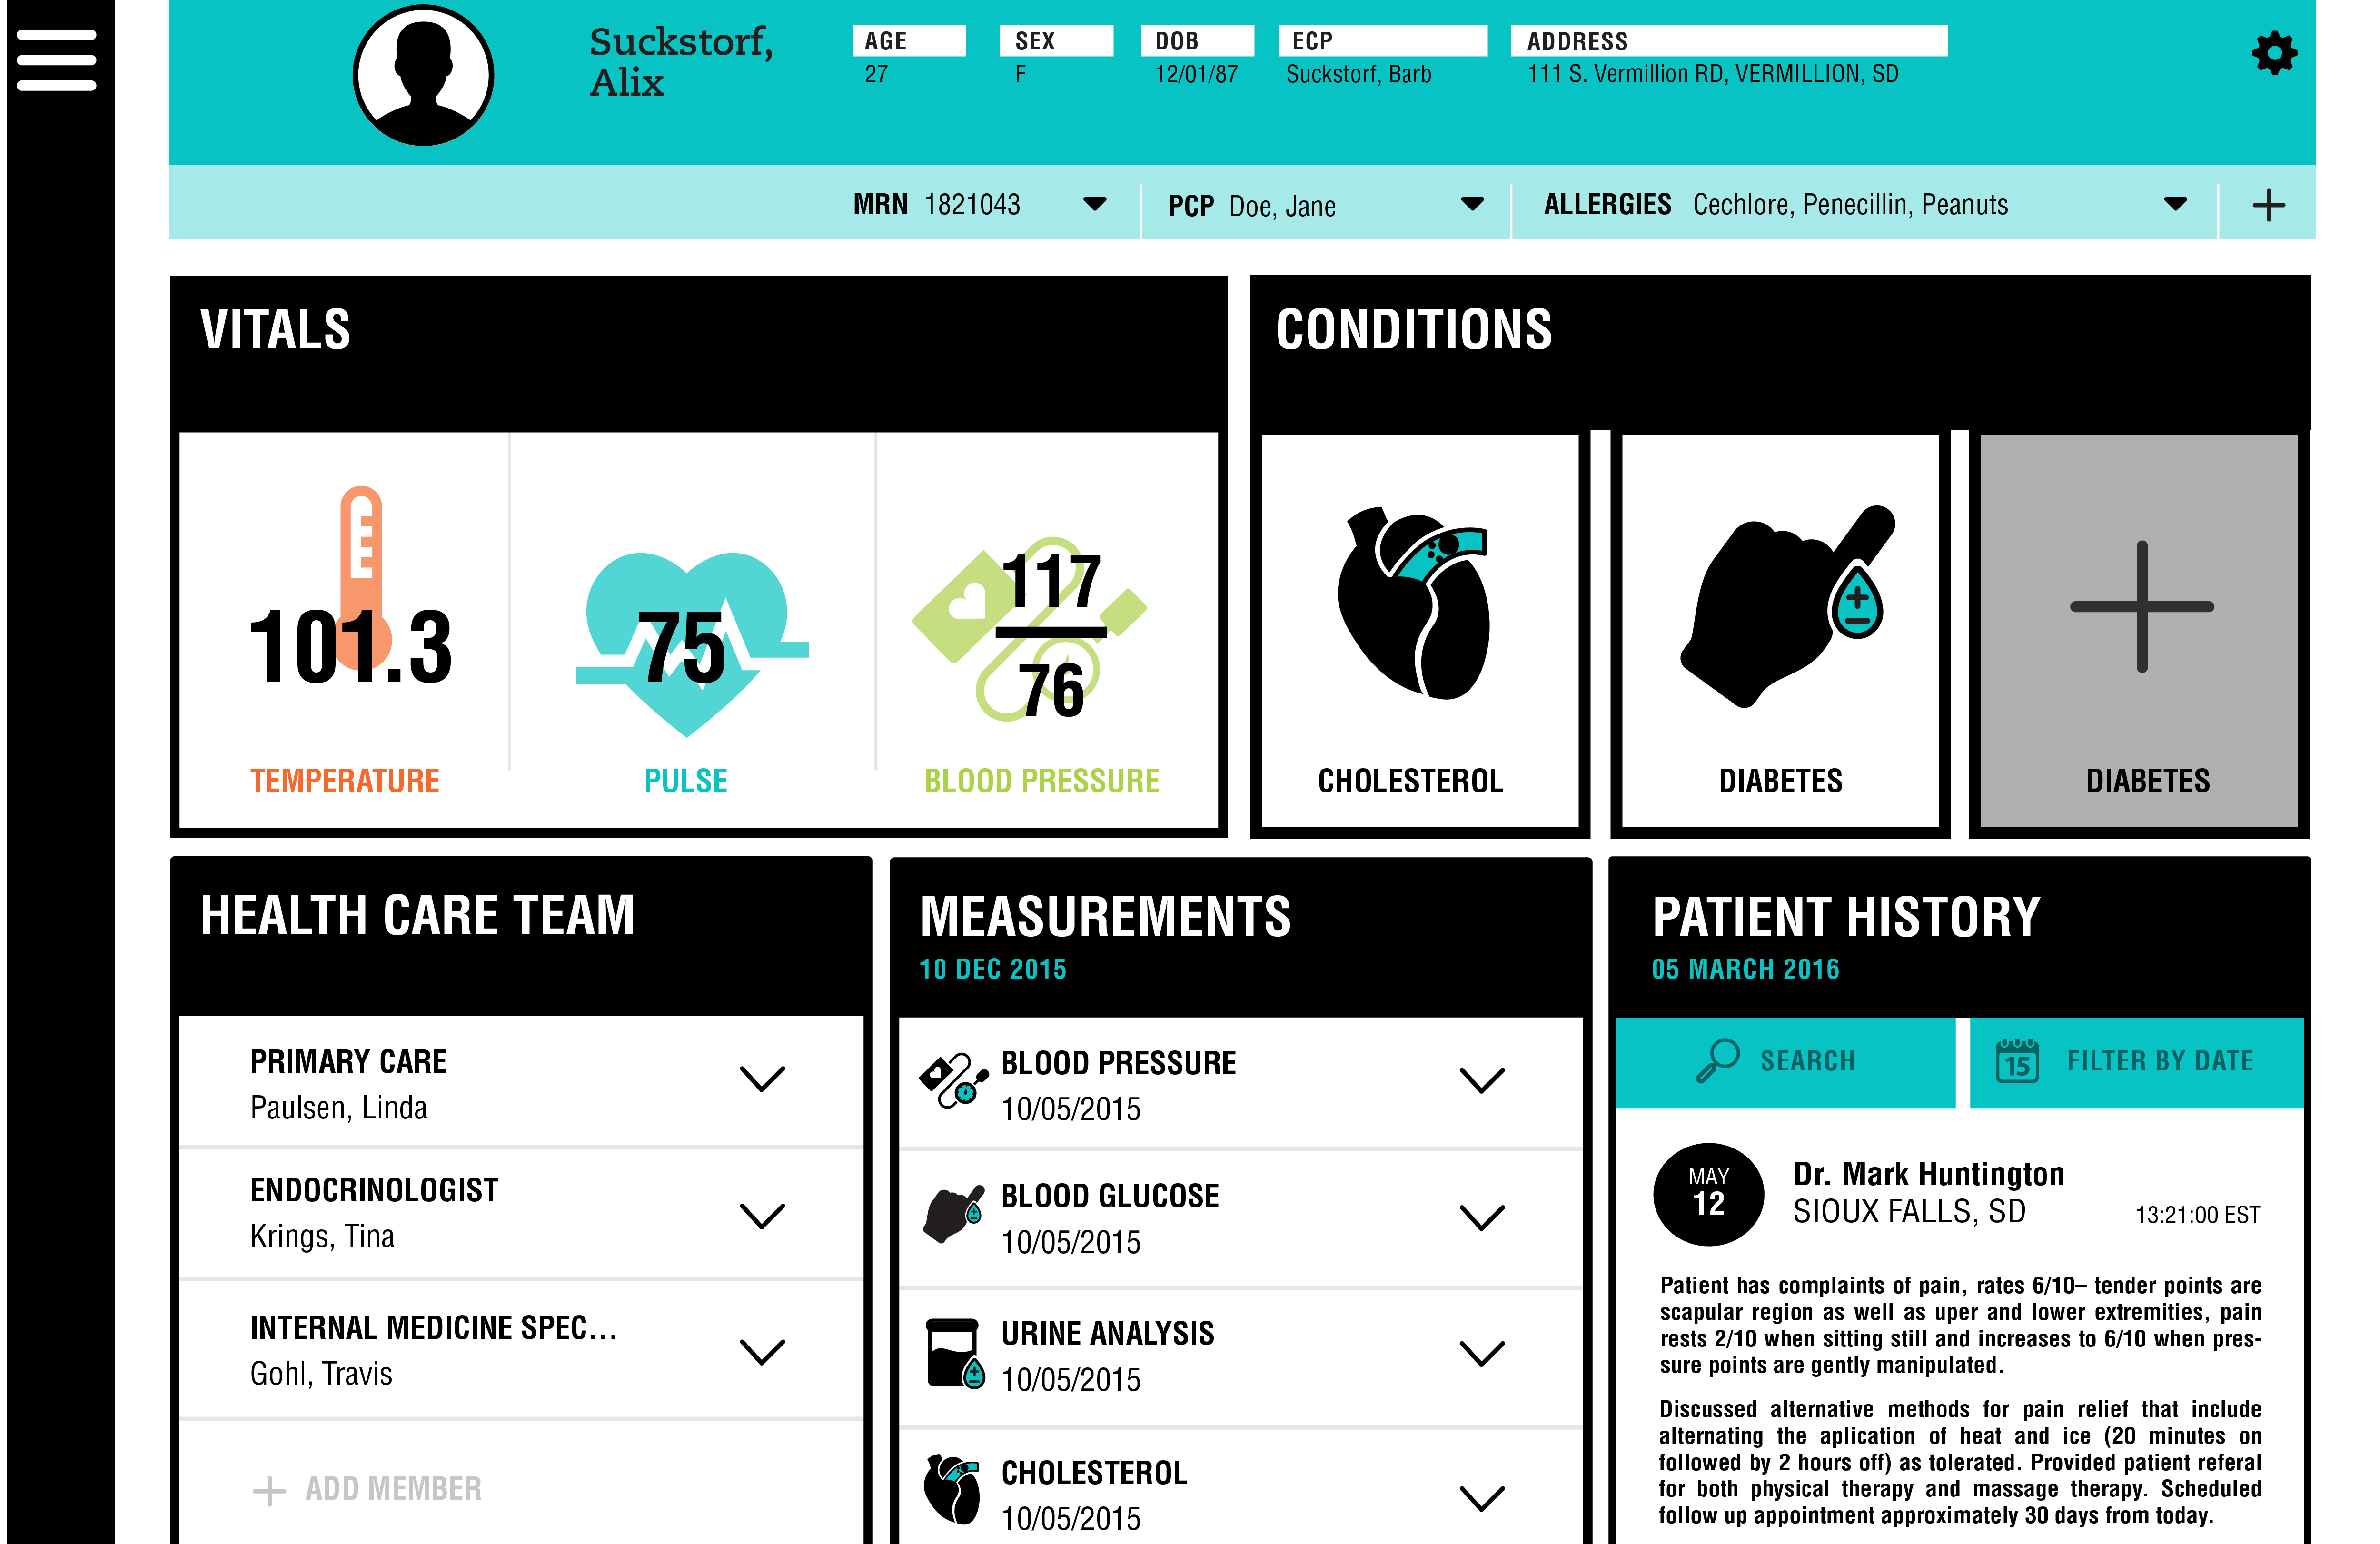
The ending result is a project branded Signifi in which six quality measures for diabetes were transformed into pictographic representations. Feedback to the pictograms and their application were gathered over the course of one week at a public installation. The findings assert the need for a greater emphasis on visual communication in situations where medical information is exchanged.
Signifi was submitted for completion of the Master of Fine Arts degree in Graphic Design at the University of South Dakota. Read More.
![]()
![]()
SURVEY COLLECTION
To gather participation Signifi utilized print surveys. Feedback collected from participants included a series of multiple choice questions on a five-point Likert scale and open-ended questions. The first component gathered the user groups’ demographics and health literacy.
In the survey participants were also asked to provide their response to the traditional EHR display. Results from this data set titled Quality of Experience demonstrated the users’ general viewing pleasure compared to Signifi. Results validate findings from previous research, further demonstrating the need for adherence to graphic best practices and an emphasis of user-centered design.
![]()
![]()
![]()
SURVEY PARTICIPATION
Signifi asked participants to draw symbolic interpretations of medical terminology used in the prevention and management of Type II Diabetes (fig A.4). The six terms were quality measures for Type II Diabetes including 1) Eye exam; 2) Lipid management; 3) Foot exam; 4) Blood pressure; 5) HbA1c testing and management; and 6) Urine protein. Results from this component were used to determine the most common interpretation, which in return gave insight to the design process.
![]()
![]()